Plotting functions
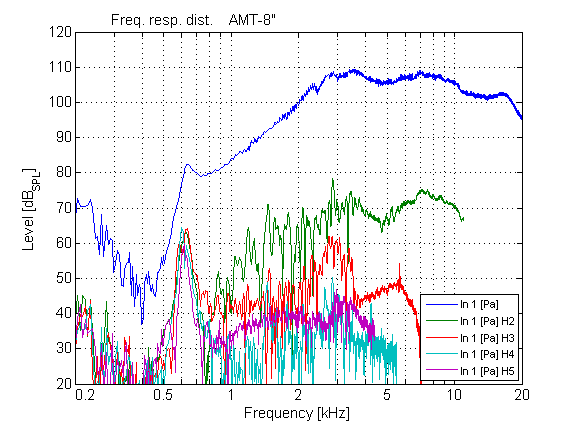
Curve plots with legend:
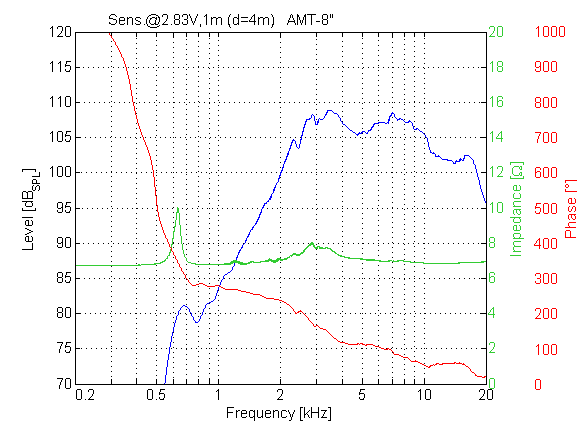
Plots with multiple axes using up to three different data sources:
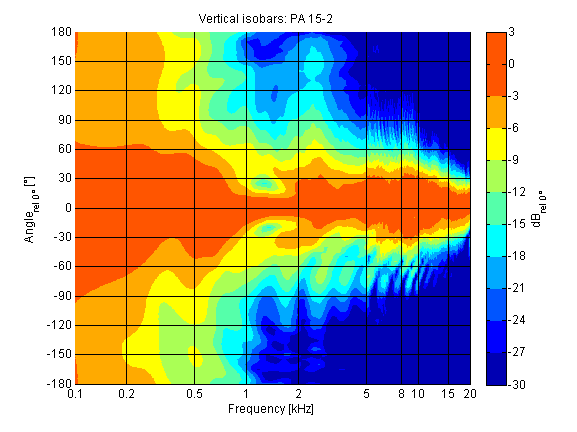
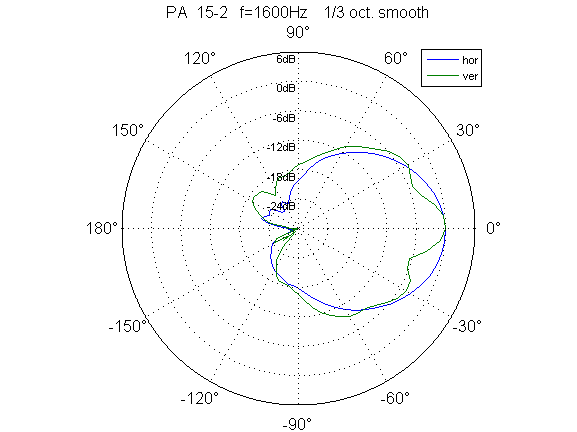
Isobaric plots from polar response measurements:
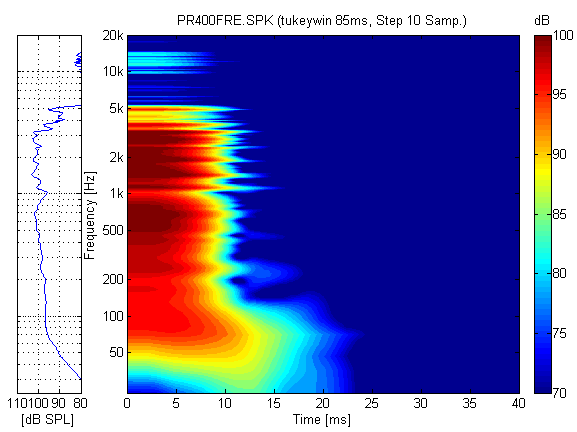
Plotting spectrograms with or without supplementary frequency response display:
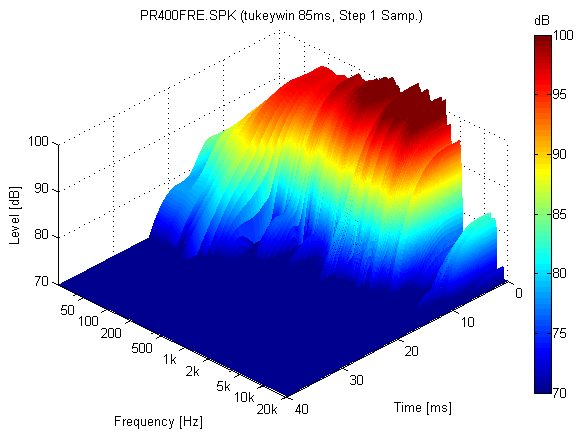
Plotting of waterfall diagram: